|
|
|
1.
|
What is the median? ____________________________________________
A | The smallest value | B | The middle value | C | The largest
value | D | The most frequent value |
|
|
|
2.
|
What is the maximum? ___________________________________________
A | The smallest value | B | The middle value | C | The largest
value | D | The most frequent value |
|
|
|
3.
|
What is the mode? ____________________________________________
A | The smallest value | B | The middle value | C | The largest
value | D | The most frequent value |
|
|
|
4.
|
What is the minimum? ___________________________________________
A | The smallest value | B | The middle value | C | The largest
value | D | The most frequent value |
|
|
|
5.
|
 Use pencil and paper to answer the
question. Use pencil and paper to answer the
question.Camilo asked 7 boys in his fifth-grade class how many sports they like to
play. Here are the results of his survey: 0 7
1 8 7 4
5 a. What was the median number of sports
played? ________ b. Camilo concluded: The typical fifth grader likes about 7
sports.
Do you agree with his conclusion? Explain.
___________________________
______________________________________________________________
c.
Describe two ways Camilo could improve his survey. ______________________________________________________________
______________________________________________________________
|
|
|
6.
|
|
|
|
7.
|
 Use pencil and paper to answer the
question. Use pencil and paper to answer the
question.What is the fraction pair represented by the drawing below?
|
|
|
8.
|
 Use pencil and paper to answer the
question. Use pencil and paper to answer the
question.Write a pair of fractions with common denominators for the drawing below.
|
|
|
9.
|
Stephanie is writing a report on eating habits, sleep, and dreams. She gave a
survey to the students in her class. Which question best goes with the graph shown
below? 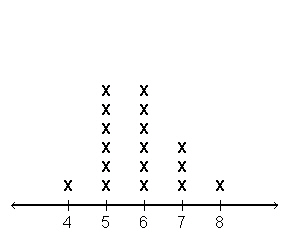 A | About how many snacks do you eat between your evening meal and bedtime?
| B | About how many dreams do you remember having in an average week? | C | About how many hours
do you sleep each night? | D | About what time do you usually eat your evening
meal? |
|
|
|
10.
|
 Use pencil and paper to answer the
question. Use pencil and paper to answer the
question.Find the median and mode of each stem-and-leaf plot below. a. | Stems
(10s) |
Leaves
(1s) | b. | Stems
(10s) |
Leaves
(1s) | | |
1 | 1 9 | |
1 | 3 5
| | |
2 | 0 2 3 3 3 4
9 | |
2 | 0 2 3 4 6 6
| | |
3 | 2  | |
3 | 1 | | | | | | | | | | median: ____________ | | median:
____________ | | | mode: ____________ | | mode:
____________ | | | | | | |
|
|
|
11.
|
 Use pencil and paper to answer the
question. Use pencil and paper to answer the
question.Jerome's class made these estimates for the number of jellybeans in a
jar: 140, 155, 138, 147, 146,  103, 126, 154, 183, 146, 132,  146, 126,
121   Stems
(100s and 10s) | Leaves
(1s) | 10 | 3 | 12 | 1 6  | 13 | 2 8 | 14 | 0  6 7 6 7 | 15 | 4 5  | 18 | 3  | | |
a.
Explain the mistake in the stem-and-leaf plot for the jellybean estimates. ___________________________________________________________
___________________________________________________________
b.
Create a new stem-and-leaf plot to make the stem-and-leaf plot correct.
|
|
|
12.
|
 Use pencil and paper to answer the
question.a. Use pencil and paper to answer the
question.a. Use your ruler to draw a line segment that is  in.
long. b. If you erased  inch from this line segment, how long
would it be? ________ c. If you drew a line segment twice as long as the original
line, how long would it be? ________
|
|
|
13.
|
 Use pencil and paper to answer the
question. Use pencil and paper to answer the
question.
One survey reported favorite types of books for fifth graders. The results of
the survey were as follows: adventure books: 39% mystery books: 30% comedies: 20% other:
11% a. Which of the following bar graphs best
represents the survey results? __________________
b. If 100 students answered the survey, how many of them chose
other?
____________
c. If 10 students answered the survey, how many of them chose
comedies?
____________
d. If 50 students answered the survey, how many of them chose
mysteries?
____________
e. If you were trying to decide what kinds of books to buy for
the library in your town, how many fifth graders would you interview?
____________
Explain why you chose
that number.
___________________________________________________________
___________________________________________________________
|
|
|
14.
|
 Use pencil and paper to answer the
question. Use pencil and paper to answer the
question.Explain how you would use the multiplication rule to find the common denominator for
the given fraction pair:  and  _____________________________________________________________ _____________________________________________________________ _____________________________________________________________
|
|
|
15.
|
 Use pencil and paper to answer the
question. Use pencil and paper to answer the
question.Explain one way to rename  as a percent without using a
calculator. ________________________________________________________________ ________________________________________________________________
|
|
|
16.
|
 Use pencil and paper to answer the question. Use pencil and paper to answer the question.
Mean
AgeImagine a family of seven people. Pretend you are one of the 7 people in the
family. The average age of this family is 21
years.
| a. | List the ages of all seven people in the family. Describe the relationship each of the
imaginary family members has to you - for example, my mom, my younger sister, etc. | | | | | | | | | | | b. | Explain how you used
the mean to find the ages of the family members. | | | | | | | | | | | |
|